Data, Dashboards & Reporting in Vienna
When every monthly report costs days in Excel and each department has different numbers, a shared data foundation is missing. AUTOMATA brings together data from ERP, CRM, online shop and accounting in Vienna and makes it understandable in dashboards – current, automated and tailored to each role. AI analytics help spot anomalies and trends earlier.
from €3,900 net, fixed price after a free initial call
What we deliver
- Data integrationData from ERP, CRM, online shop, accounting and spreadsheets is combined automatically.
- Data warehouseOne central, cleaned data foundation with consistent KPI definitions.
- DashboardsClear cockpits for management, sales, production or controlling.
- Automated reportingReports are generated on schedule and distributed by email or as PDF.
- AI analyticsForecasts, anomaly detection and questions to your data in natural language.
- Data quality and permissionsValidation rules, access concepts and documentation so figures stay reliable.
What you gain
- One shared set of figures instead of conflicting Excel reports.
- Current KPIs at the click of a button instead of days of manual preparation.
- Deviations and trends become visible before they get expensive.
- Each role sees exactly the KPIs it needs for its decisions.
Who is it for?
For SMEs whose reporting today consists of hand-copied spreadsheets, and for enterprises that want to give business units fast, reliable analytics alongside central BI.
Technologies
- Python
- SQL
- PostgreSQL
- dbt
- Power BI
- Apache Superset
- Metabase
- Grafana
Process
- 01
First conversation
We listen, ask the right questions and clarify goals, scope and budget. Free and without obligation.
- 02
Concept & proposal
You get a clear concept with scope, timeline and a transparent proposal – no endless back and forth.
- 03
Design & prototype
Clickable designs show early how the result will feel. This is where changes cost the least.
- 04
Development
We build in short sprints and regularly show you working increments.
- 05
Launch
Testing, data migration, training and a go-live without nasty surprises.
- 06
Operation & evolution
Maintenance, monitoring and new features – we remain your point of contact.
Questions & answers
How does a dashboard project run, and how long does it take?
We start with the most important KPIs and data sources and deliver a first dashboard with real data early on. We then expand step by step; duration depends mainly on the number and condition of data sources.
How much do dashboards and automated reporting cost?
Cost depends on the number and accessibility of data sources, data quality and the reporting scope you need. After a free initial consultation, you receive a proposal with a clearly defined scope of work.
Do you work with Power BI or build your own dashboards?
Both are possible. If you already use Power BI or another BI tool, we build on it; otherwise we integrate dashboards directly into your web application or use proven open-source solutions.
How do AI analytics help in practice?
AI can produce revenue or demand forecasts, flag unusual values automatically and translate questions such as "Which customers ordered less this quarter?" into queries. Results remain verifiable because they are based on your own data.
Related work
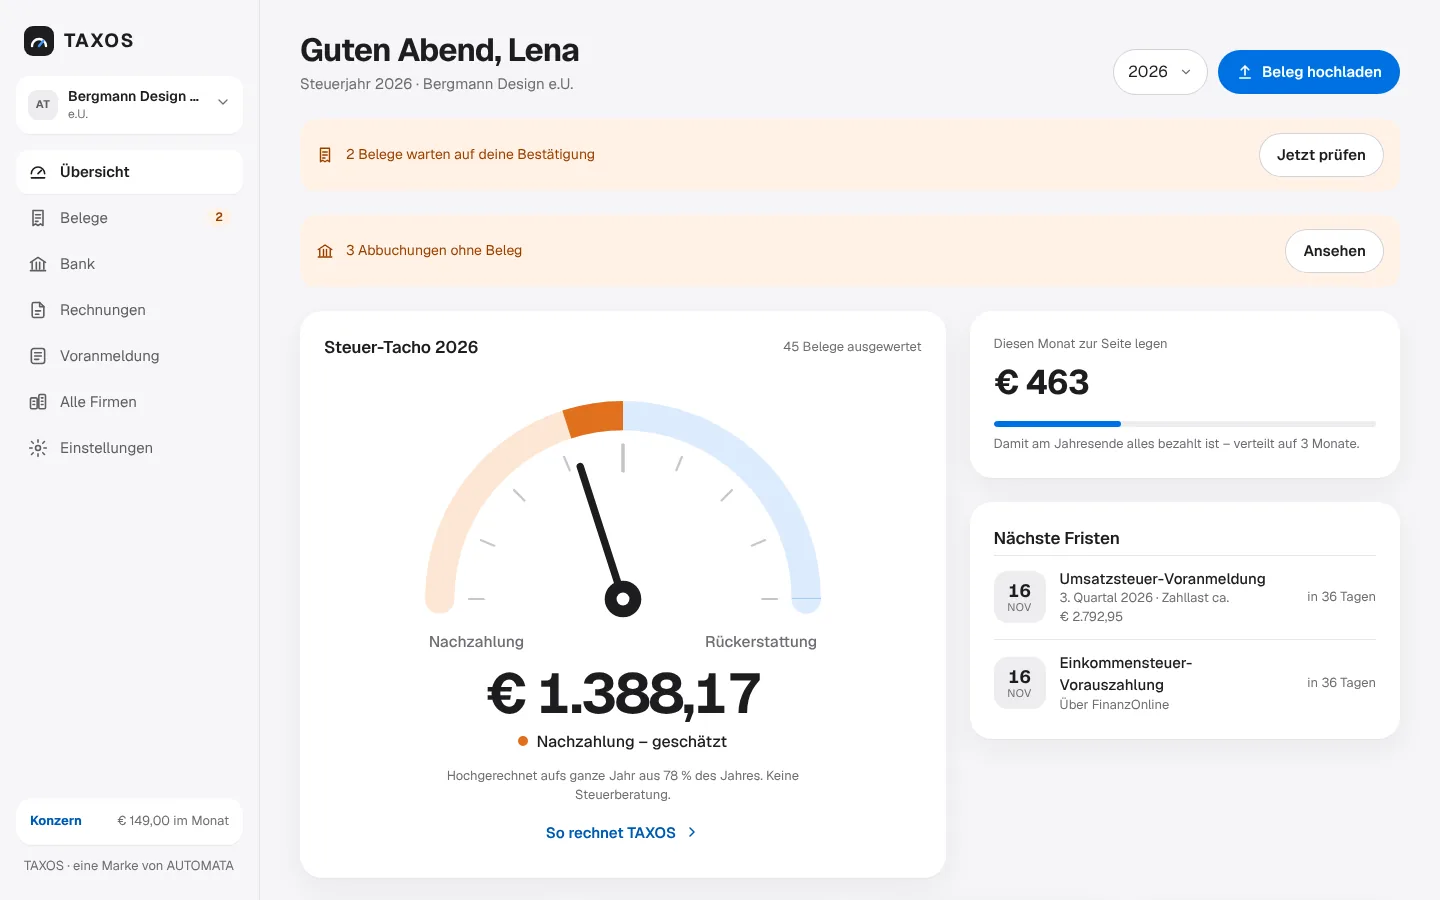
TAXOS
TAXOS is bookkeeping for everyone: snap a receipt, done. The app classifies every receipt for tax purposes and shows at any time what will be due to the tax office at year end – or what comes back. For freelancers, SMEs and groups of companies in Austria and Germany.
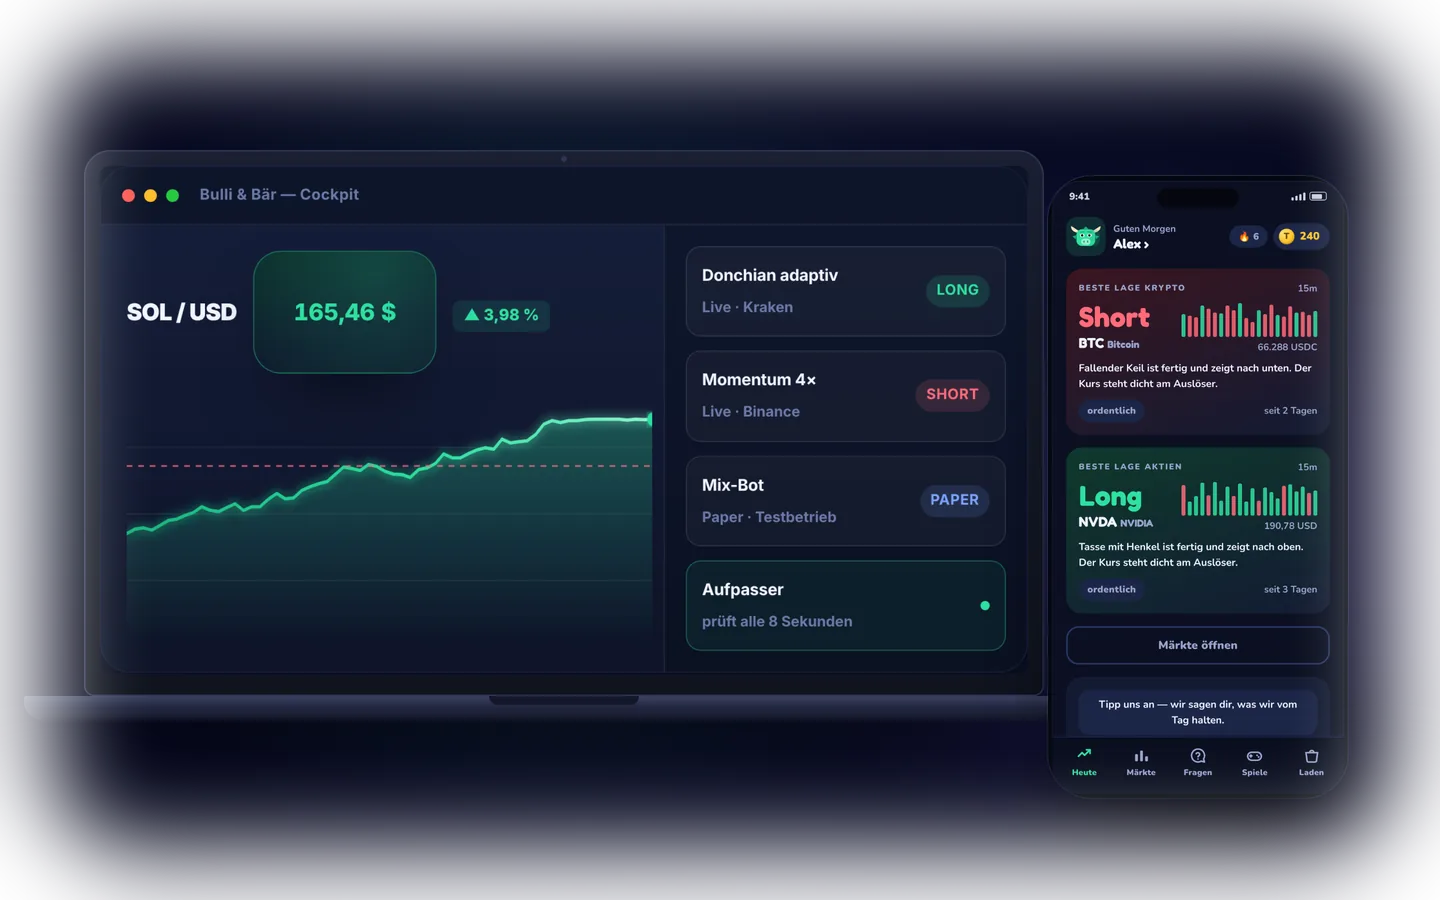
Bulli & Bär
Bulli & Bär is one product in two editions: desktop software for Windows and Mac that runs rule-based trading strategies in test mode and live via Kraken and Binance – and a mobile app that boils market analysis down to one question: long, short or wait.
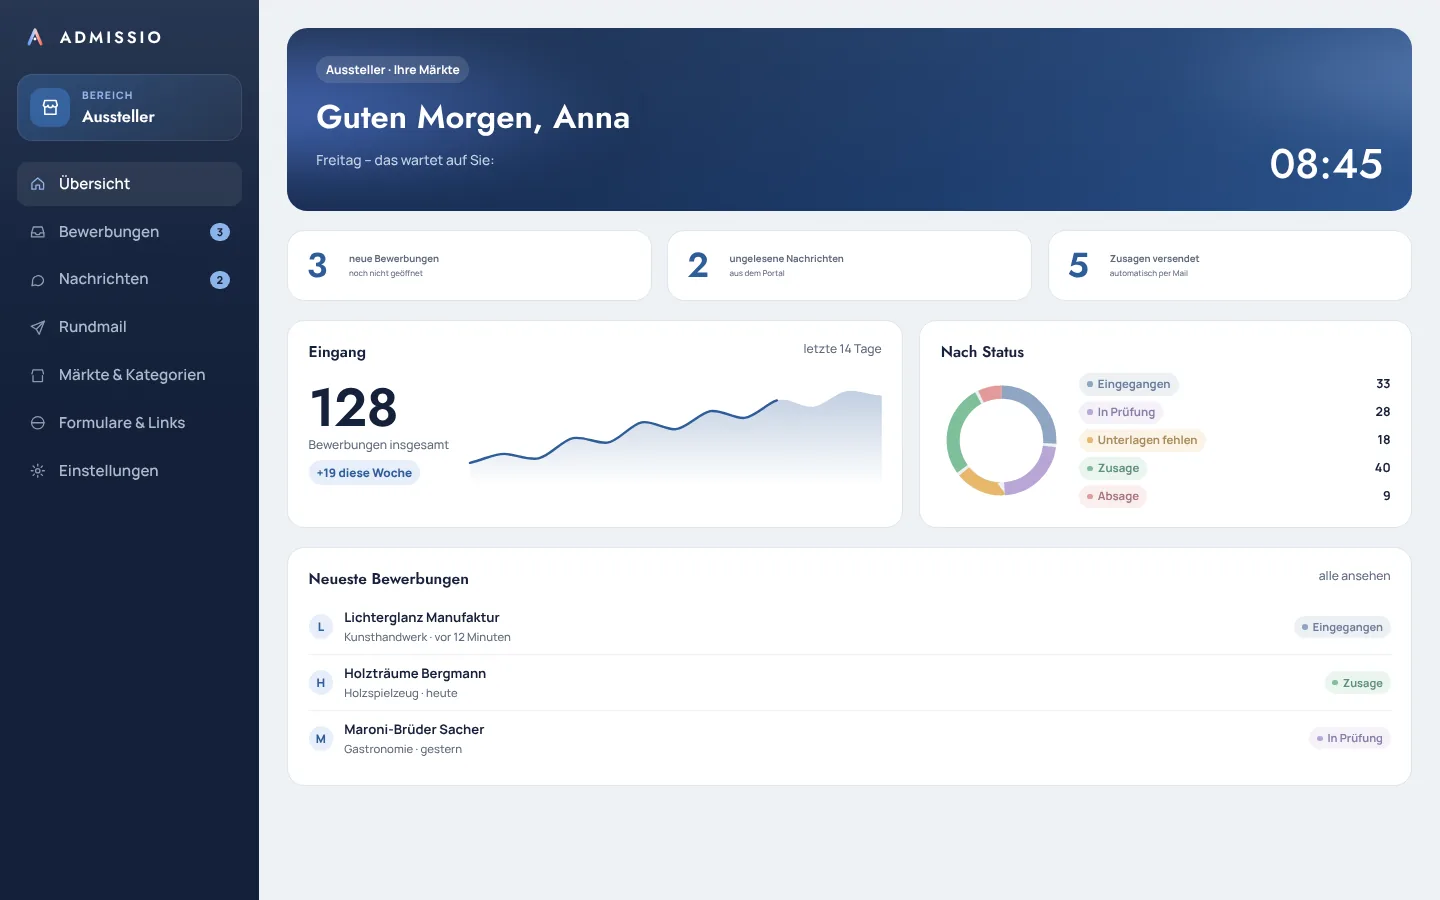
ADMISSIO
ADMISSIO is an application platform for markets, events and seasonal businesses: exhibitors and staff apply online, and the team reviews, decides and informs with a single click. The software runs on the operator's own web space and is unlocked by licence.